SVETLANA PANASYUK
Medical Hyperspectral Imaging
Optical Metrology
Tissue Spectroscopy
Mantle Flow
GPS
Remote Sensing
Image Processing
Fun
Reference Earth Model
|
Medical Hyperspectral Imaging System detects changes in oxygenated hemoglobin and deoxyginated hemoglobin that indicate variations in oxygen delivery and oxygen extraction. A healing wound requires an increased blood supply that is also highly oxygenated. We have carried a number of studies to understand the processes of wound healing,
starting with animal studies at BIDMC, Harvard Medical School. The paper describing
results of our study is submitted. Below is a short description with an illustration:
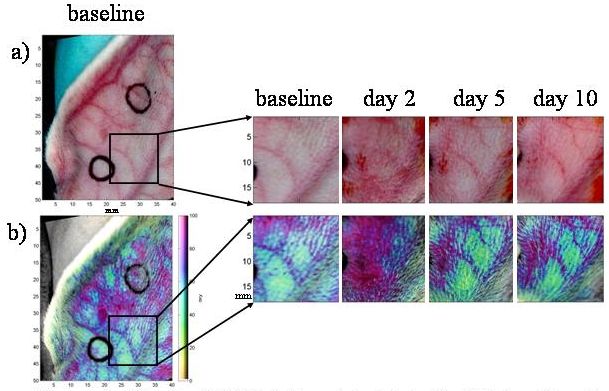
The 50-micron resolution images of a rabbit’s ear taken with MHSI (Medical Hyperspectral Imaging) system (HyperMed, Inc.) over 10 days period. The color image (a), reconstructed from MHSI data, shows a part of the observed area 50-by-40 mm, recorded at the baseline on day 1. The black rings denote location of a future wound – puncture. The pseudo-color image (b), obtained as a result of hyperspectral processing, shows distribution of the oxygenated (oxy) and deoxygenated (deoxy) hemoglobin in the underlying tissue at the same time. The color hue represents apparent oxy concentrations, whereas color saturation (from fade to bright) represents apparent deoxy concentrations. Both, oxy and deoxy, vary predominantly between 40 and 90 mhsi units (colorbar to the right). The series of images to the right show change in a region of interest 17-by-17 mm (black box in a) and b)) over 10 days following the puncture wound initiated at day 1. At day 2, the oxy concentrations increased significantly in the area as far as 10 mm away from the wound border. By the day 5, the increase in oxygenation became more local (purple area “shrunken” to about 5 mm) and new microvasculature formed to “feed” the area in need (red fork-like vessels in the right top corners appearing in the images for days 5 and 10). By the 10-th day, the area of increased oxy has not changed much, but the peak in oxy amplitude decreased, suggesting a period of steady healing. Work was done while at HyperMed, Inc: HyperMed |
 Wound Healing