SVETLANA PANASYUK
 Home Home
Resume
Publications
Medical Hyperspectral Imaging
Basics
Device
Diabetes
Wounds
Cancer
Shock
Optical Metrology
Defects
Medical
Automotive
Tissue Spectroscopy
Fluorescence
D-Reflectance
Device
Mantle Flow
Convection
Drift
Geoid
Compressibility
Inversion
Topography
Phases
Superplasticity
Hemisphere
GPS
Tien Shan
GPS
Sky Map
Errors
Remote Sensing
Vectors
Satellites
Image Processing
Deblurring
Registration
Recognition
Fun
Geosystems
Colormap
Chaos
Bubbles
Harmonics
Reference Earth Model
about
data
map_view
slice
isosurface
rms
correlation
vis5D
|
|
|
|
|
 Color Maps
are a convenient indexing scheme in MATLAB. In my research I found that the
standard colormaps are not enough, and I need to be able to create and change
new colormaps "on the fly". Color Maps
are a convenient indexing scheme in MATLAB. In my research I found that the
standard colormaps are not enough, and I need to be able to create and change
new colormaps "on the fly".
A long time ago, I wrote a user-friendly code that allows to create
a custom colormap map. Program has a graphical user interface (see below).
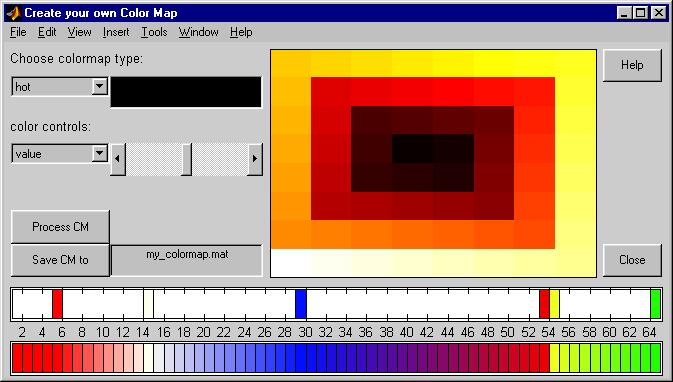
It displays the colors
in the colorful spiral at the center of the figure.
You can choose any color from the spiral and place it on
the top bar with the number below. Numbers represent the row number of that particular
color in the Matlab defined 64x3 color matrix.
Once you placed all desired colors (at least two), press the 'Process CM' button.
Colors will be interpolated
(or/and extrapolated) to create the continuous gamma.
You can also edit (by all means) your colormap!
Since so many people have contacted me asking for the code, I put it
here. You could use the code as is, but please honour the authorship.
|
|